How to Read Your Houston Electric Bill and Know If Your AC Is the Problem
Understand your Houston electric bill to check if your AC is increasing your costs. Learn key indicators of efficiency and save money.
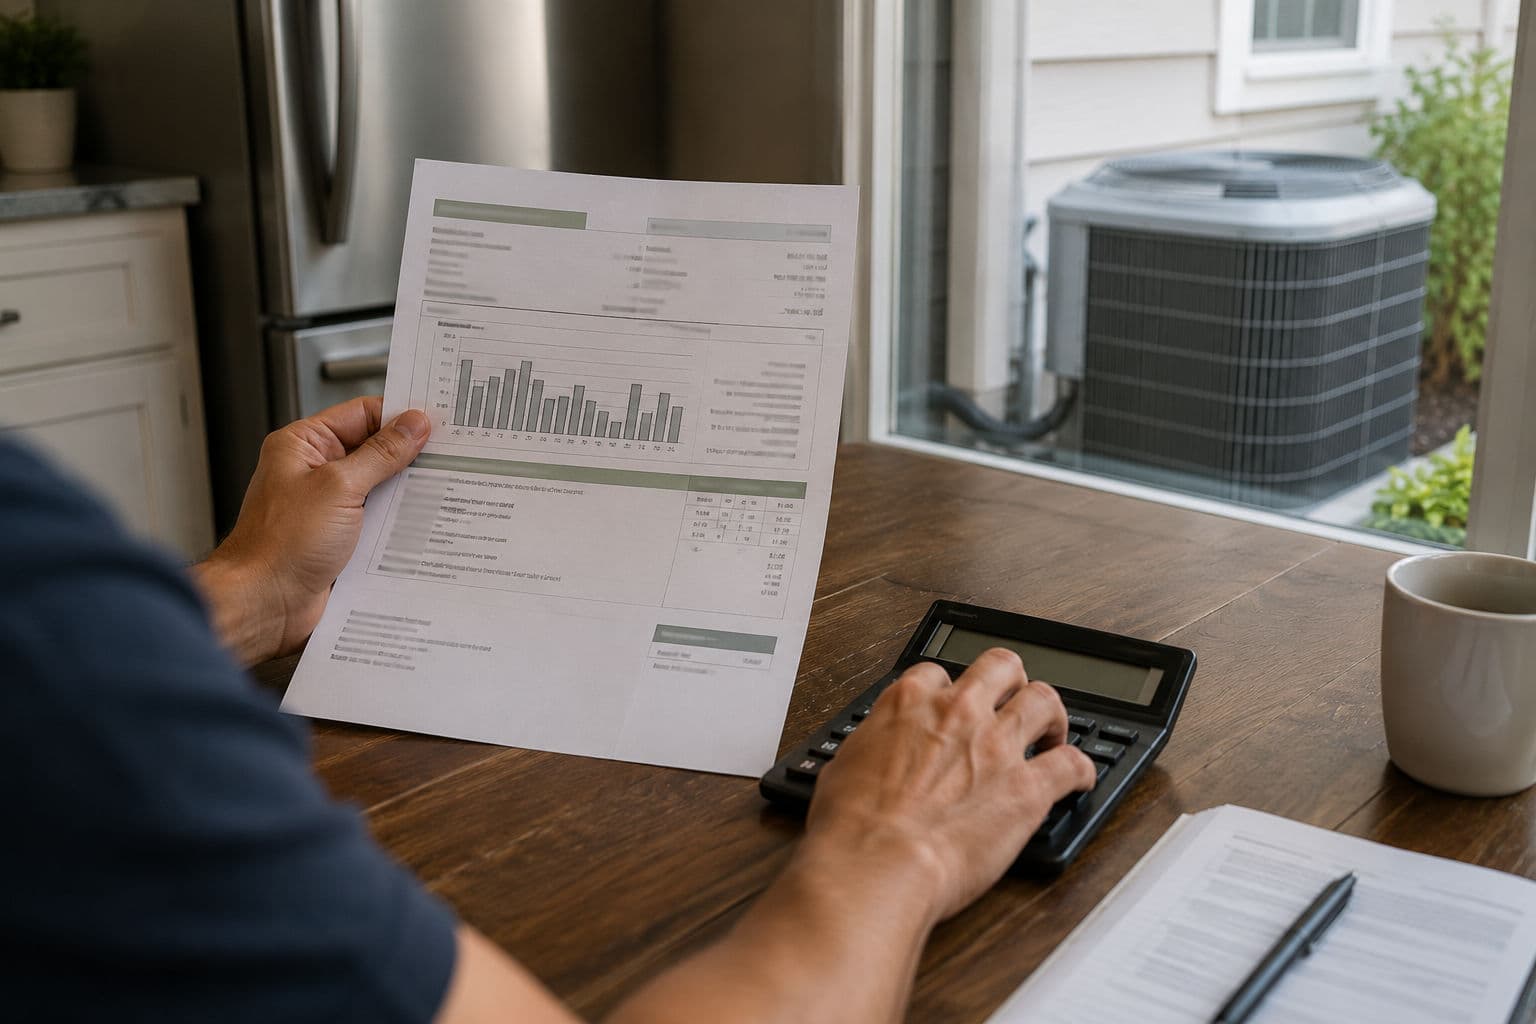
Most Houston homeowners look at their summer electric bill, see a number that's higher than they'd like, and either accept it as the price of living in Houston or turn the thermostat up a degree and hope for the best. Very few actually read the bill in a way that tells them whether the cost is reasonable for their home and system, or whether something specific is driving it higher than it should be.
Your electric bill contains more information than just the total amount due, and understanding what that information means gives you a way to evaluate whether your AC system is performing efficiently or costing you more than it should. Here's how to read it and what to look for.
THE KEY NUMBERS ON YOUR HOUSTON ELECTRIC BILL
Total kilowatt-hours consumed. This is the most important number on your bill and the one that most directly reflects how hard your AC has been working. Kilowatt-hours — kWh — measure the total amount of electrical energy your home consumed during the billing period. Your bill shows the current period's consumption and in most cases a comparison to the same period last year, which is the most useful reference point for evaluating whether your consumption is normal.
For a typical Houston home between 1,800 and 2,500 square feet with a mid-efficiency AC system in reasonable condition, summer monthly kWh consumption commonly ranges from 1,500 to 2,500 kWh during July and August. Larger homes, homes with older less-efficient systems, and homes with poor attic insulation will run higher. Smaller homes or homes with newer high-efficiency equipment will run lower.
If your consumption is significantly above this range for your home's size, or significantly higher than the same month last year without an explanation, your AC system is worth having evaluated.
Average daily use. Many Houston utility bills break down consumption by average daily kWh use, which is more useful than the total because it accounts for billing periods of different lengths. Your daily kWh use during summer is almost entirely AC-driven — in most Houston homes, cooling accounts for 50 to 60 percent of total summer electricity consumption, and on peak summer days the AC can account for 70 percent or more.
Tracking your average daily kWh use across summer months and comparing it to the same months in previous years is the most reliable way to detect a gradual efficiency decline in your AC system. A system that's losing efficiency doesn't announce itself — it just costs a little more per day to run than it did last summer, and a little more than that the summer after.
Rate per kWh and rate tiers. Your rate per kWh — what you pay per unit of electricity consumed — determines how much each unit of AC efficiency gain or loss translates into dollars. In the Greater Houston area, electricity rates vary by provider and plan structure, and some plans include tiered pricing where consumption above certain thresholds is billed at a higher rate per kWh.
If your plan has tiered pricing and your AC consumption is pushing you into a higher-cost tier during peak summer months, improving AC efficiency isn't just reducing the volume of kWh you consume — it's reducing how many of those kWh are billed at the higher tier rate. The savings per kWh avoided are higher in the upper tier than in the base tier, which increases the return on any efficiency improvement during peak summer months.
Demand charges. Some utility plans in the Houston area include demand charges in addition to consumption charges. A demand charge is based on your peak power draw during the billing period — the highest power level your home reached, even briefly, rather than your average consumption. Your AC compressor startup draws significantly more power than steady-state operation, and a system that starts and stops frequently — as an oversized system short cycling does — generates repeated peak demand events that can drive demand charges higher than a correctly sized system running longer, steadier cycles would.
If your bill includes a demand charge line item and it seems high relative to your overall consumption, AC short cycling from oversizing is one of the possible contributors worth investigating.
COMPARING THIS YEAR TO LAST YEAR
The year-over-year comparison is the most useful analytical tool in your electric bill for detecting AC system changes. It controls for weather differences between months — if July this year was hotter than July last year, higher consumption is expected and doesn't necessarily indicate a system problem. But if consumption is significantly higher than last July with similar temperatures and the same household occupancy and usage habits, something has changed that warrants attention.
A few ways to make the year-over-year comparison more meaningful:
Use degree days rather than calendar dates to compare weather. A cooling degree day is a measure of how much cooling was needed on a given day based on how far the average temperature was above a comfort baseline. Your utility may provide a degree day comparison on your bill, or you can find historical cooling degree day data from weather services. Comparing kWh per cooling degree day between this year and last year removes weather variability from the comparison and isolates system performance changes more clearly than a simple month-to-month comparison.
Account for occupancy changes. More people home during the day — remote work, school being out, additional family members — increases indoor heat generation and AC demand in ways that are independent of system efficiency. A fair comparison assumes similar occupancy patterns between the periods being compared.
Account for thermostat setting changes. A thermostat set two degrees lower than last summer explains a meaningful portion of higher summer consumption. If you've adjusted your thermostat habits, factor that in before attributing the consumption increase to the system.
If year-over-year consumption is significantly higher after accounting for these variables, the most likely causes are an AC system that's losing efficiency due to dirty coils or low refrigerant, a refrigerant leak that's developed since last summer, a capacitor or contactor that's causing the system to run less efficiently, or duct leaks that have worsened. All of these are diagnosable during a professional service visit.
WHAT A SUDDEN SPIKE VERSUS A GRADUAL INCREASE TELLS YOU
A sudden spike in consumption from one month to the next — particularly if accompanied by comfort complaints — typically indicates a specific system failure or developing problem. A refrigerant leak that's dropped the charge significantly, a capacitor that's degraded to the point of affecting compressor performance, or a condenser coil that's become severely fouled can all produce a noticeable month-to-month consumption increase alongside reduced cooling performance.
A gradual increase over multiple summers — this year a bit higher than last, last year a bit higher than the year before — is the signature of normal system aging and efficiency decline. Every AC system loses efficiency gradually over its service life, and in Houston's climate where the system runs more annual hours than almost anywhere else in the country, that decline is faster than in moderate markets. A system that was installed at 14 SEER eight years ago may be effectively operating at 11 or 12 SEER today due to accumulated wear, coil fouling, and normal component degradation.
Gradual increases are harder to notice than sudden spikes because each individual year's change is small. Looking at your consumption numbers going back three or four summers rather than just comparing this year to last provides a clearer picture of the trend. If consumption has been climbing steadily for three or four years, the system is aging in a way that's showing up in energy costs before it shows up as a comfort failure.
USING YOUR BILL TO ESTIMATE YOUR AC'S ENERGY SHARE
If you want to estimate how much of your summer electric bill is specifically attributable to AC operation, a useful approach is to compare your summer bills to your winter bills when heating demand is low and cooling demand is zero. In Houston, a mild winter month — December or February in a year without extreme cold — represents your home's baseline electricity consumption without significant HVAC load: lighting, appliances, water heating, electronics, and other non-HVAC loads.
The difference between that baseline and your peak summer consumption is approximately your air conditioning's share of the summer bill. If your February consumption was 800 kWh and your July consumption was 2,200 kWh, approximately 1,400 kWh of the July bill is attributable to air conditioning — roughly 64 percent of the total July consumption.
This calculation isn't perfectly precise because summer lighting patterns differ from winter, appliance use varies by season, and in some homes electric resistance heating contributes to winter consumption. But it gives you a useful order-of-magnitude estimate of your AC's energy footprint that you can use to evaluate the potential savings from efficiency improvements.
WHAT TO DO WITH THIS INFORMATION
If your bill analysis suggests your AC is consuming significantly more energy than it should for your home's size and your system's age, the next step is a professional diagnostic visit to identify what's driving the inefficiency.
Before scheduling service, gather a few months of recent bills alongside the same months from the previous year and note the kWh numbers and any degree day comparison the utility provides. This information is genuinely useful to the technician — a pattern of consumption that's been climbing for two summers alongside reduced cooling performance points toward efficiency decline from normal aging and coil fouling. A sudden increase from last month to this month alongside comfort complaints points toward a specific developing failure. The consumption data helps distinguish between these scenarios before the technician even looks at the equipment.
Multipoint AC & Heating provides AC diagnostic, repair, and maintenance service throughout Greater Houston, including Harris County, Fort Bend County, Montgomery County, and Austin County. If your summer electric bills suggest your AC is working harder than it should, contact us to schedule a diagnostic visit.